We have been reviewing the role of z-scores (also known as standard scores) and, to help clarify a few essential points, let me offer the following:
1. A score derived from a test or scale is meaningless by itself unless it can be compared to the distribution of scores from some reference group (recall the “Are you impressed with someone who catches a 50 pound Northern Pike?” example). Hence, once a reference group is established, a single measure then becomes meaningful (the average Northern Pike seldom exceeds 10 pounds so, with that knowledge, I would certainly be impressed)
2. The process of dividing a deviation of a score from the mean by the standard deviation is known as the transformation to standard scores (or z scores). Symbolically, z is defined as:
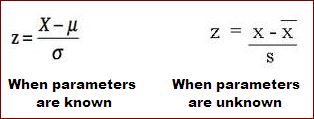
3. The difference between “s” and “z” is straight forward: The standard deviation (s) is a measure expressing dispersion in original units of measurement. A standard (z) score is a raw score (“X” in the formulas above) converted into standard units, i.e., a number of standard deviation units from the mean. Consider “s” to be discrete and “z” to be continuous in its form and application.
4. The value of this conversion to standard (z) scores is that it: (1) Always yields a mean of zero and a standard deviation of one. However, it doesn’t “normalize” a non-normal distribution such as one that is highly skewed. (2) If the population of scores is normal on a given variable, we can express any raw score (“X”) as a percentile rank by referring our z to the standard normal distribution (i.e., a sampling distribution of z scores). Click here to see this sampling distribution. (3) We can compare an individual’s position on one variable with her or his position on a second.
5. In short, by transforming the scores of a normally distributed variable to z-scores, we are, in effect, expressing these scores in units of the standard normal curve. As we reviewed the characteristic of the standard normal curve (SNC) in class, you should be familiar with them.
6. When you attempt to calculate and interpret z-scores (click here for your latest z-score exercises), you will need the mean and standard deviation. This information either will be calculated by you from raw scores comprising a sample or will be given to you as a set of sample statistics or population parameters. It either case, it will be assumed that the variable(s) to be assessed are normally distributed.
7. I recommend following a few guidelines when you approach z-score exercises.
a. First, always diagram each problem so you can visualize what it is that needs to be done. That’s how we approached this in class, using the board. Are you seeking the percent of cases that fall between a z score and the mean? The area that falls below or above the z? The percentile ranking of that z in the general population? This is necessary so you can VISUALIZE the area between a given z (which you calculated) and the mean, the area below or beyond a given z, the area between two z scores and, as previously stated, the percentile rank of a given z in the general population. SO PLEASE DIAGRAM YOUR PROBLEMS. You will be expected to do so on your exam.
b. Second, recognize that whenever a raw score is below the mean, the resulting z will be negative and vice versa. This translates into the following rule when you are identifying percentile rankings. For a positive z, use Column B in the sampling distribution (found at Broken Pencils). For a negative z, use Column C.
c. Third, remember there are steps involved in this process. Once you have a mean, standard deviation and one or more raw scores with which to work, and an idea of what problems you need to address (see 7.a above), you must transform the raw score into a standard (z) score. Next, given your understanding of the problem that needs to be solved, the resulting z-score must be identified in TABLE A – the sampling distribution of z – to complete the exercise.
d. Finally, be certain that you provide your answers in their correct form. If I request the “percent of cases,” don’t give me a proportion. If I request a percentile rank, don’t provide the answer in the form of a proportion. And, please, round your z-scores and proportions to the nearest 1/100th (that is, 1.08, not 1.0833).
I hope this helps!
Professor Ziner
No comments:
Post a Comment